reduction in reporting time
Real-time insights seamlessly integrated from
data sources
IT headaches with built-in validation and error checks
Behind every powerful reporting system is well-integrated data. Kai Analytics unifies information from CRMs, surveys, ERP systems, and custom databases so your team can see one consistent, accurate view of performance.
Once we’ve evaluated and cleaned your data sources we build the automations that turn your connected data into insight. Our customized system will closely align with your workflow so you can quickly see trends, spot issues, and measure performance without digging through raw data.
We create custom visuals aligned directly to your decision-making needs, ensuring data clarity from the start. Dashboards update automatically, giving your team immediate, practical insights without technical hassle.
Our integration process ensures accuracy across platforms before visualization even begins. The result: dashboards that reflect real performance, not data inconsistencies. This includes seamless Qualtrics Power BI connections so your survey data flows directly into interactive, real-time visuals.
Every data integration project includes clear documentation, easy training videos, and reliable ongoing support. Each data pipeline is built around your specific workflows, complete with automated syncing, error checks, and visually clear reports.
The sophisticated application of artificial intelligence (AI) holds fresh potential for healthcare and adjacent fields.
Kai Analytics worked with the ACCJC to use advanced tools to provide the pertinent metrics and indicators needed to provide its members with a full understanding of where they are strong and where improvements are needed.
This effort assisted the WHO in drafting a new global traditional medicine strategy for the oeriod 2025–2034, and the resulting report and dashboards provide ongoing support for the many stakeholders involved in shaping TCIM policy.
Customized analytics dashboards designed for real-world decision-making across industries.
Quickly see enrollment trends and student performance.
Real-time insights into citizen engagement and program outcomes.
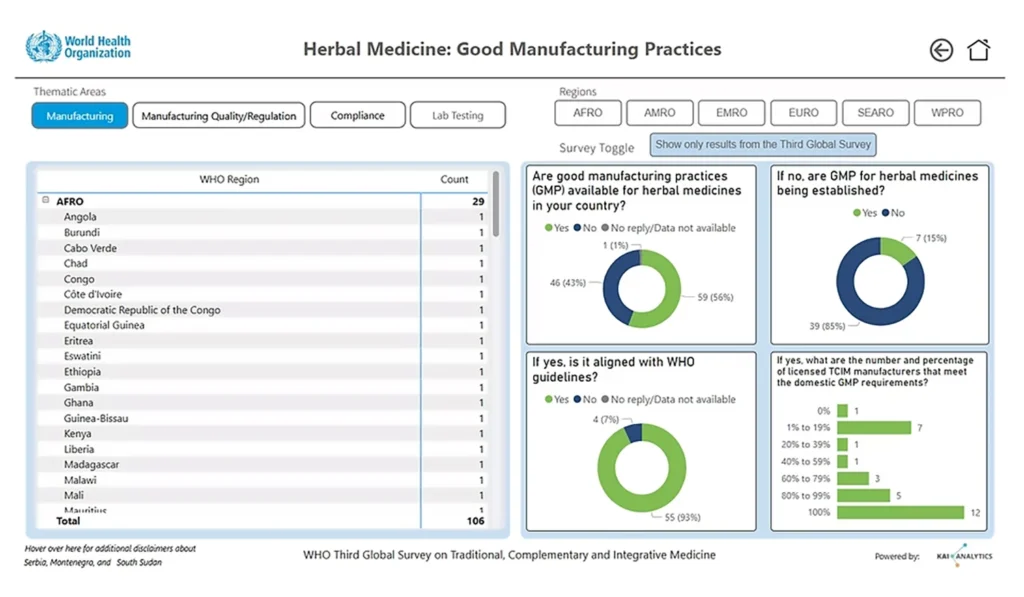
Clear visuals tracking patient outcomes and health indicators.
Easily visualize program effectiveness and funding impacts.
Dashboards showing immediate insights into market and production trends.
Instantly see employee engagement trends and productivity metrics.
Real-time dashboards for customer feedback and product analytics.
No. Our dashboards are designed for easy use by anyone, no technical background needed. We also include training videos and documentation.
Yes, dashboards are fully responsive, accessible on smartphones, tablets, and desktops.
Dashboards update automatically, ensuring you always see the most recent data.
Absolutely. Every dashboard is tailored specifically to your organization’s needs, priorities, and workflow.
Yes. We seamlessly connect dashboards with Excel, SharePoint, Oracle, cloud apps, and APIs you already use.
We strictly adhere to GDPR standards, incorporating robust privacy-by-design principles into every dashboard.
Yes. We handle Qualtrics to Power BI integration end-to-end, including API setup, automated refresh schedules, and data validation to ensure accuracy.
Let’s talk about your data challenges and explore the right solution for your team. Book a free 1-on-1 consultation with our experts to get tailored recommendations based on your goals.